As noted yesterday, the Trump win is likely to change many things around the world. Perhaps the most important issue has been making the general global populace aware of the levels of currency debasement by tyrannical politicians.
This is all being brought out into the light of day. Gold bugs and gold bulls are very aware of this but judging by the low market ratings of gold producers and explorers very few others are.
The Trump Administration will be changing things for the U.S. but their actions will only make the position in other countries far worse. And more obvious.
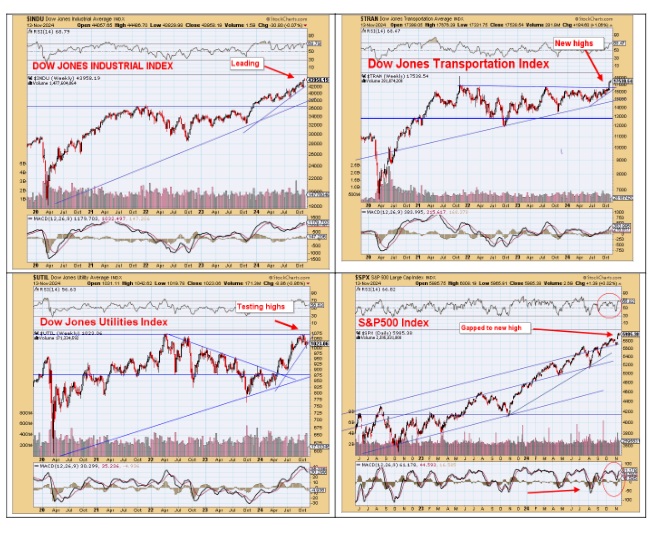
Coming into the markets, first of all, will be all that soon-to-be worthless sidelined cash flowing into general equities. The Dow Theory of the Industrials, Transports, and Utilities performing together was confirmed after the U.S. Elections, and that would suggest much of the U.S. sidelined cash would be now coming into the market.
The S&P 500 is also now very close to 6,000.
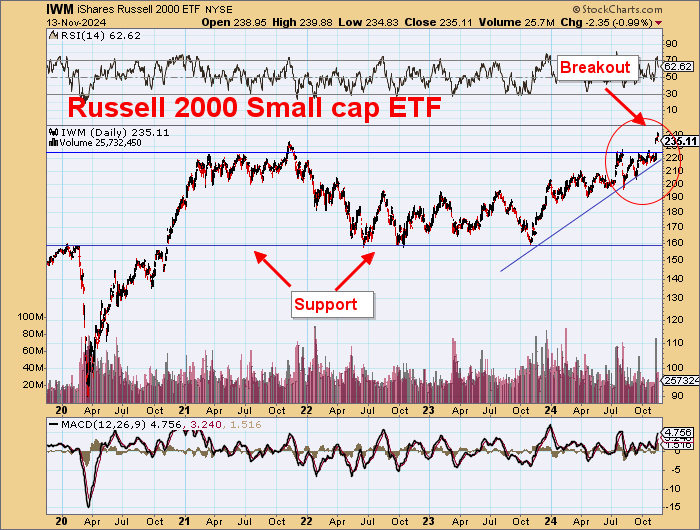
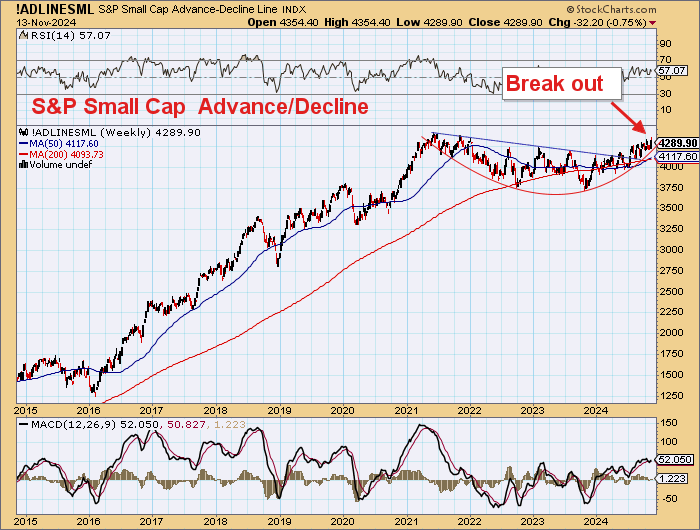
Small caps are joining in.
Russell 2000 and S&P600 jumped to new all-time highs, and the advance/decline line continues to show more small-cap stocks are rising than are declining.
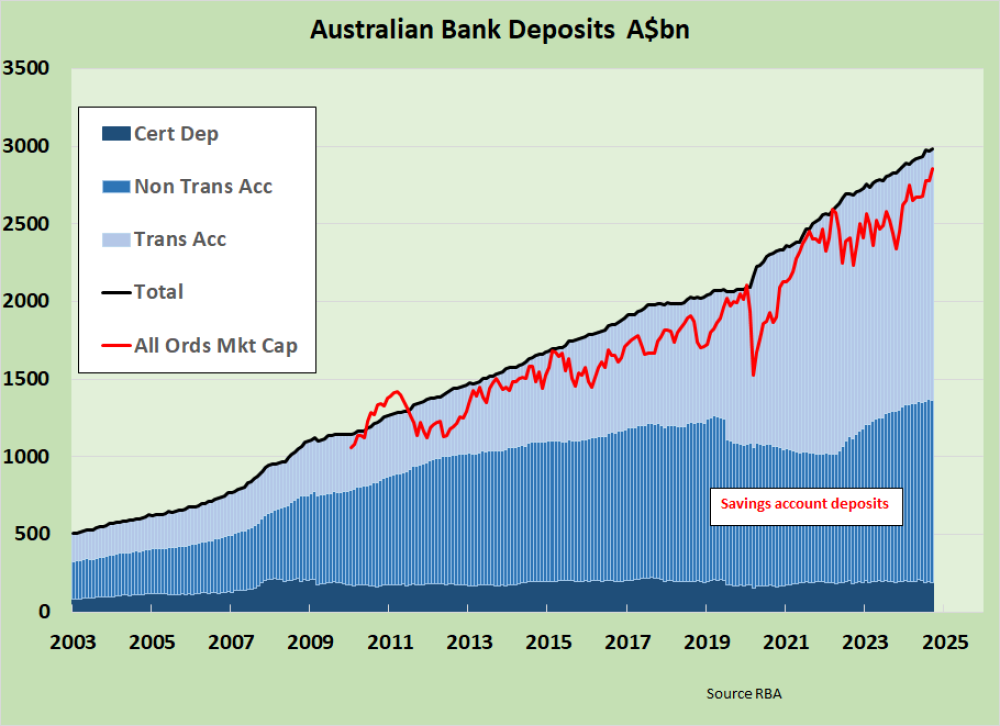
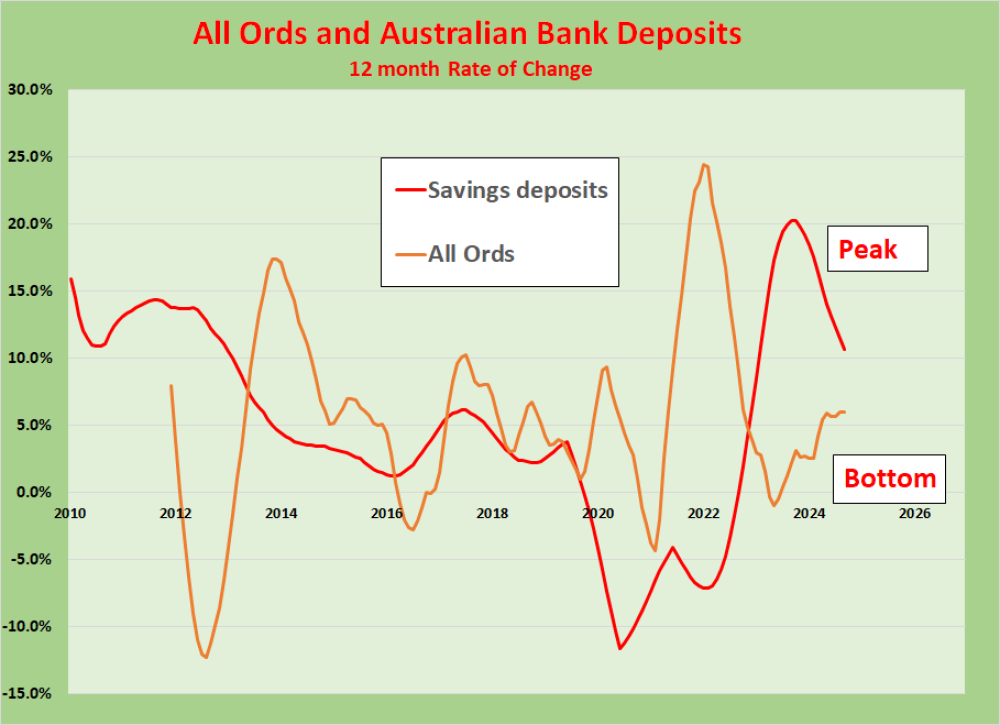
Locally, the All Ords is preparing to make new all-time highs again.
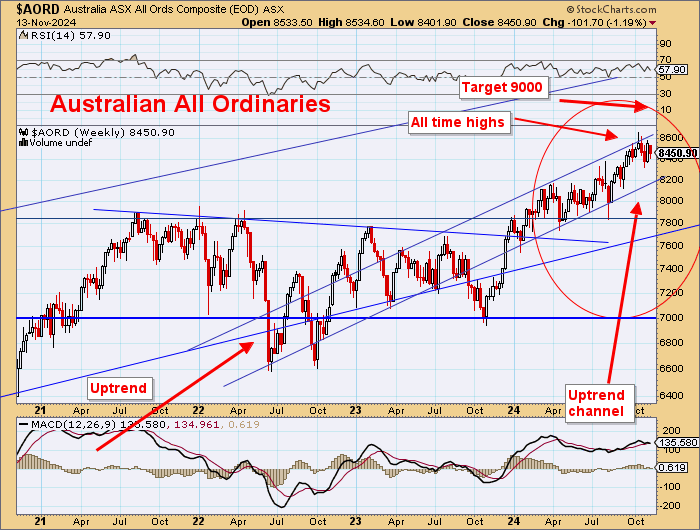
The position here in Australia shows equities rising, and the build-up in cash is peaking as cash re-enters the equities market, AU$1,617bn in savings bank accounts.
These funds will soon be coming into resources and also gold shares, eventually down to the grossly underpriced smaller caps.
Gold
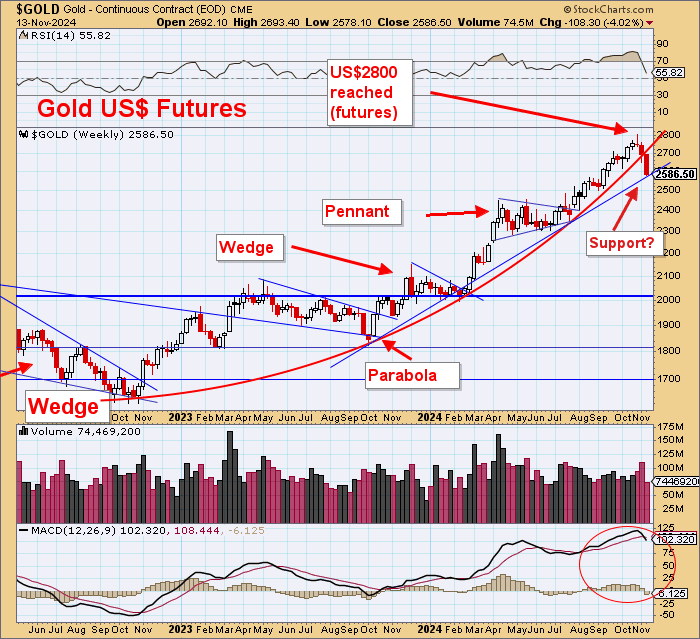
Gold has pulled back almost 10% from its late October high and now seems ready to stage at least a bounce.
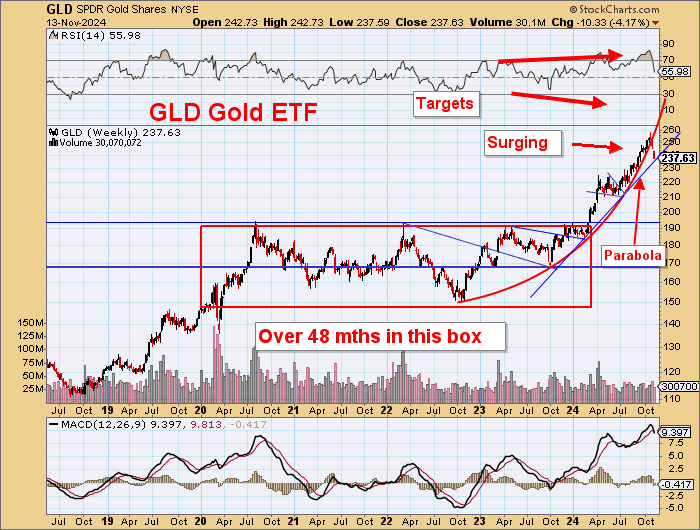
The 2-year parabola has been breached, but a steep 12-month uptrend could support a significant bounce.
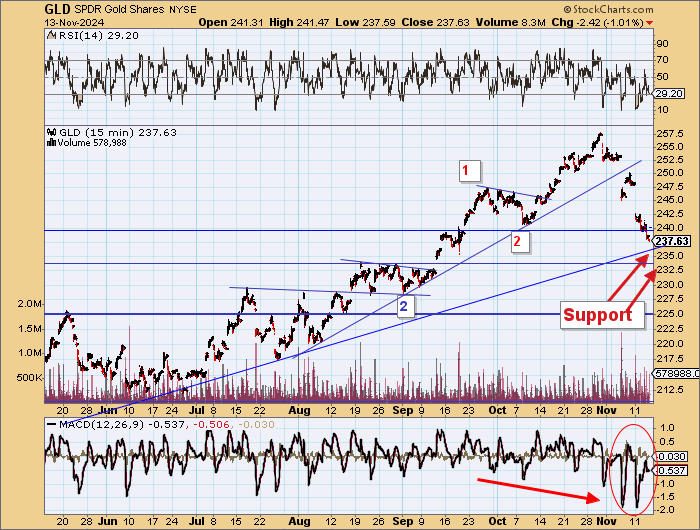
The players in the paper futures markets might have traded out, but those coming behind with general equities still have yet to come into the gold market.
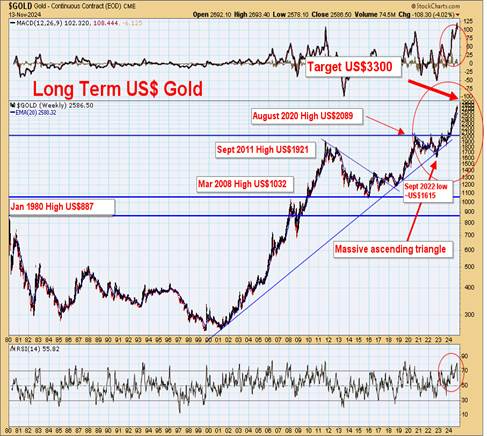
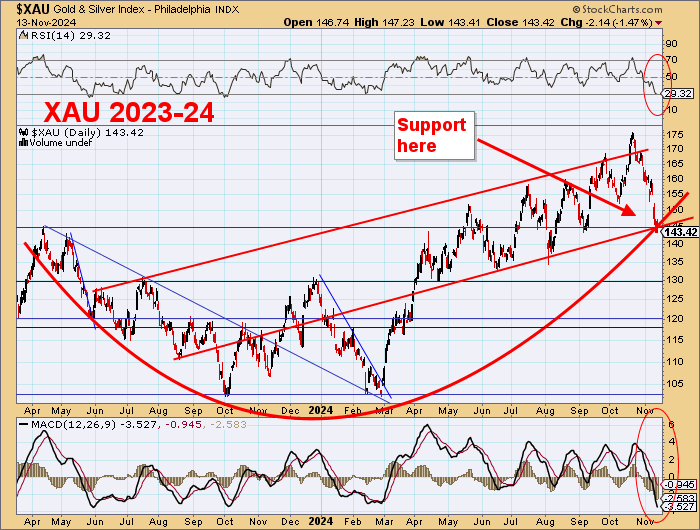
Gold stocks have also pulled back to uptrend support. The breaching of the parabola reflects the slowing of momentum in gold's rise in US$. In just 2024, there was a 40% increase in US$ gold.
However, against this longer-term chart, the price of US$ gold has barely moved. The US$248 (2001) to US$1921(2011) rise was a 10-year bull market with a 675% gain. The move from US$1615 (2022) to US$2787(2024) is only 73%.
The global sovereign debt position from money printing is far worse than in 2011, so gold will need to be priced far higher before this bull market is over.
Gold Stocks
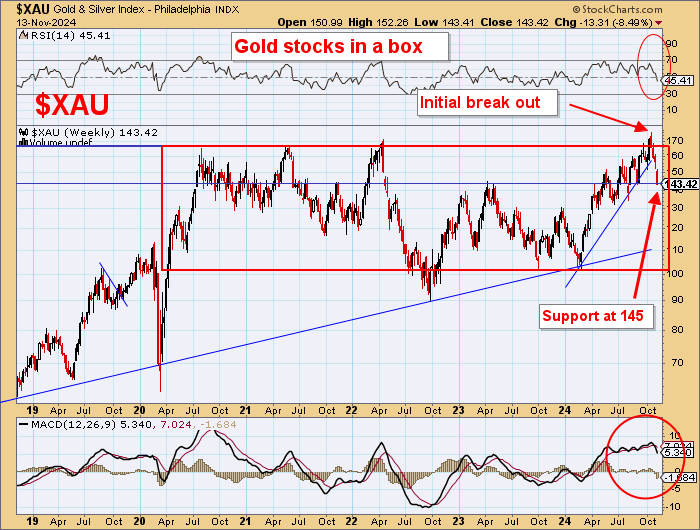
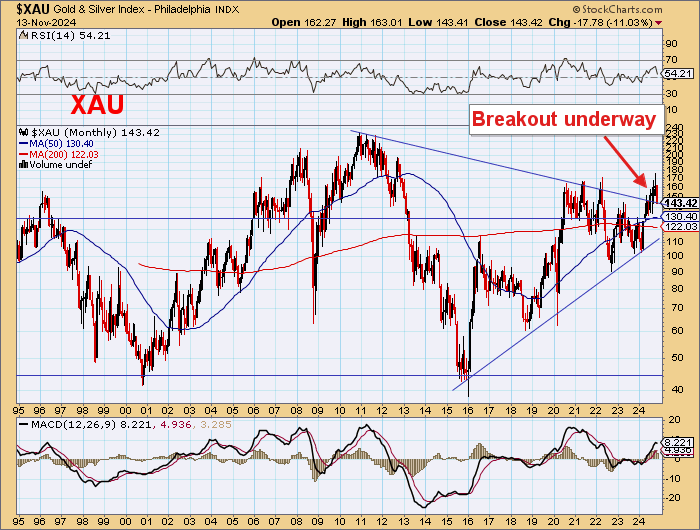
The XAU has pulled back to just below the 145 level, which is long-term major support.
But these stocks are still within their own box.
There could be more consolidation before the big breakout, but this is a very powerful formation.
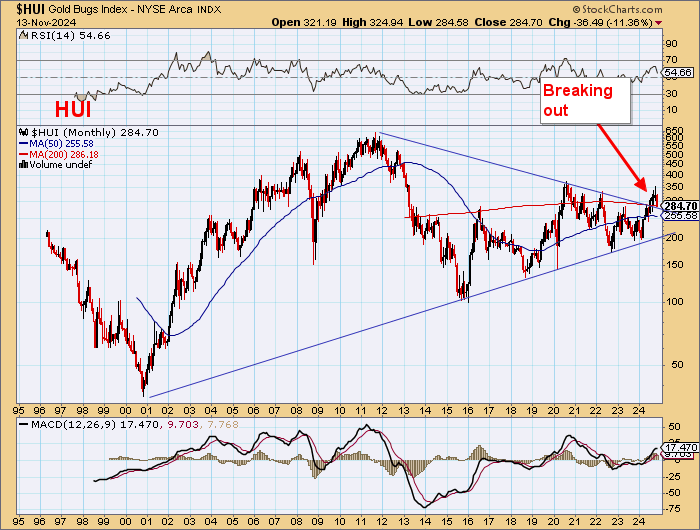
These two indices are also in very powerful formations.
Both are in massive long-term wedges with 13-year downtrends, and the HUI (the unhedged gold stocks index) has a 20-year uptrend.
These are very powerful formations.
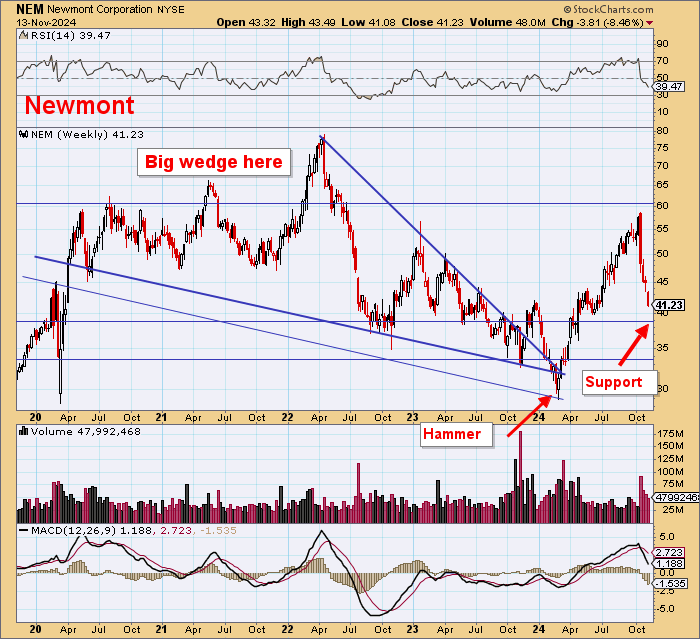
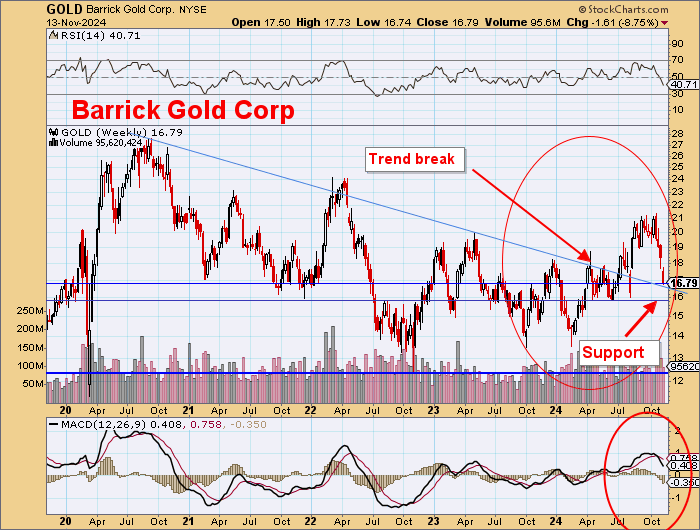
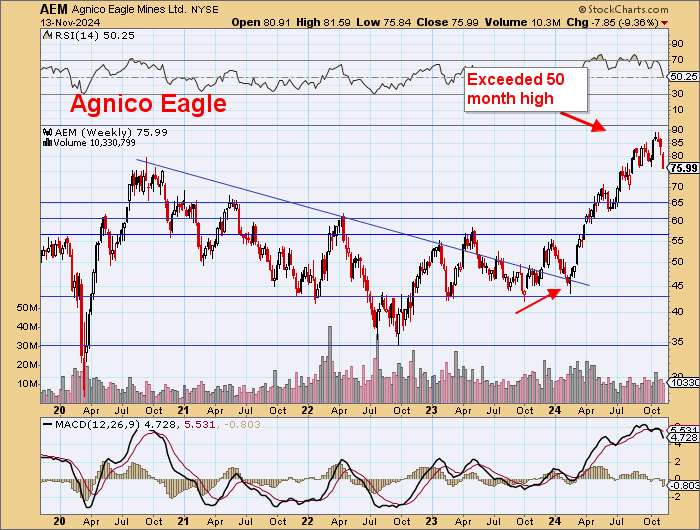
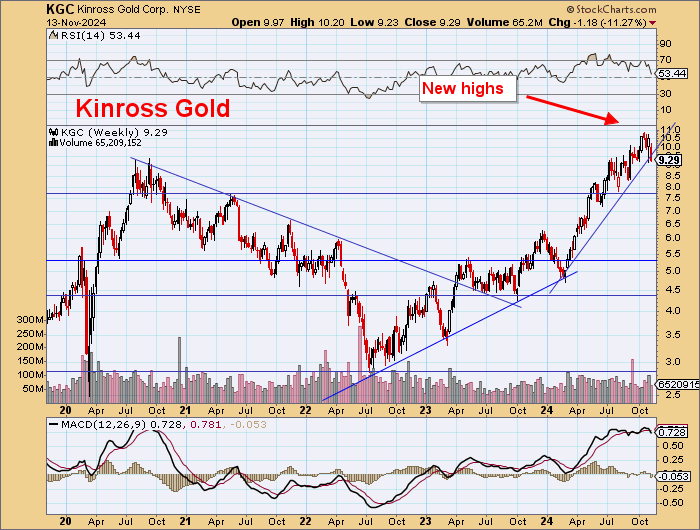
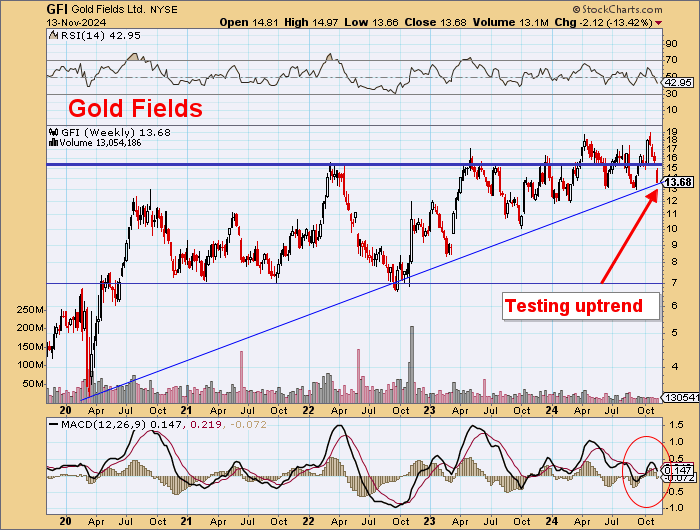
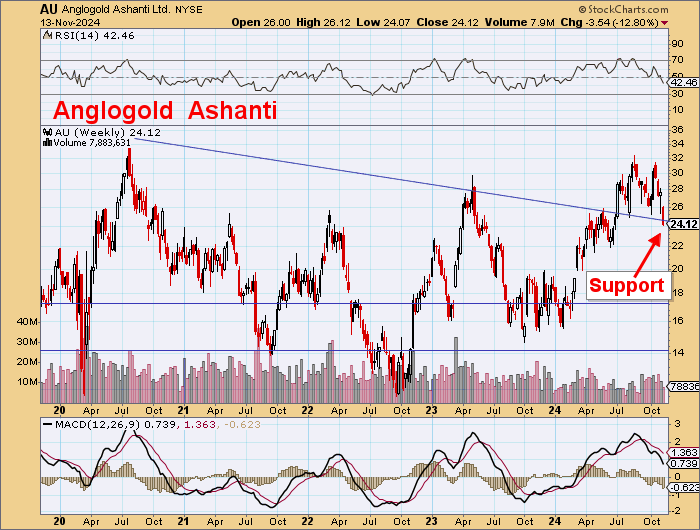
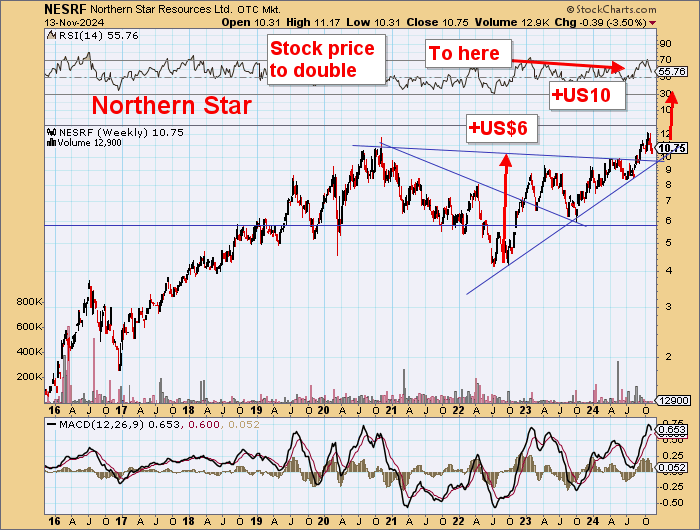
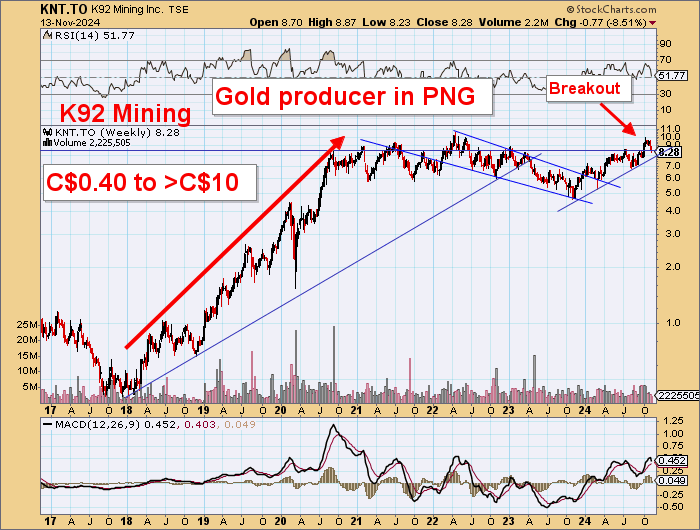
Individual North American-listed stocks have had mixed performances within the various gold stock indices. Market leaders Newmont Corp. (NEM:NYSE) and Barrick Gold Corp. (ABX:TSX; GOLD:NYSE) have been quite uninspiring, but others have done much better.
None have yet really run to strong new levels above the 2020 highs.
It is obviously only early in this gold bull market.
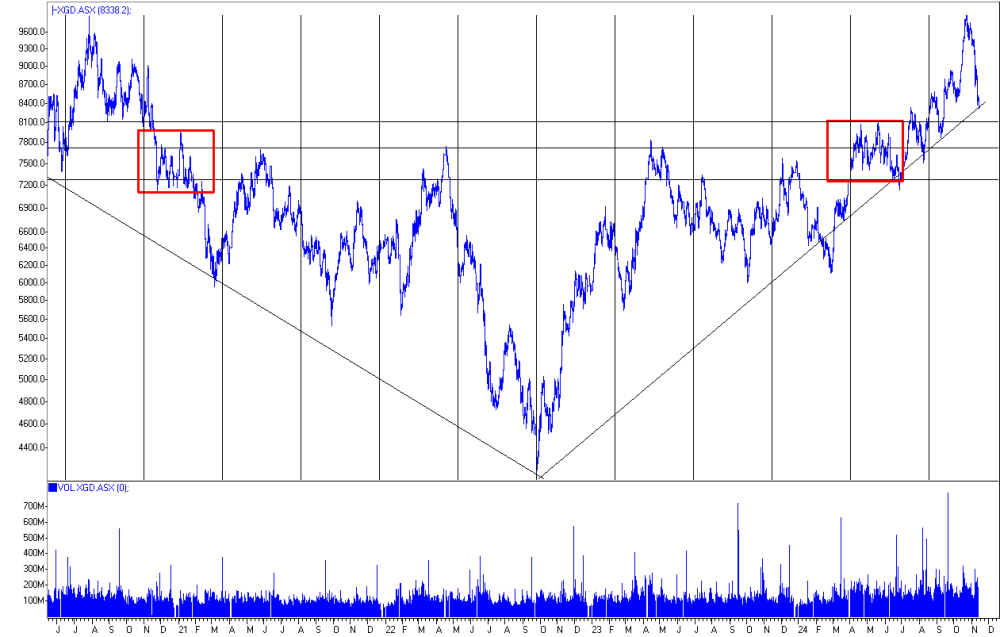
ASX Gold Index
The ASX Gold Index is ready to bounce off the 2-year uptrend.
This is also a major and powerful technical formation.
A break to new highs above 10,000 will get this market really moving.
| Want to be the first to know about interesting Gold investment ideas? Sign up to receive the FREE Streetwise Reports' newsletter. | Subscribe |
Important Disclosures:
- As of the date of this article, officers and/or employees of Streetwise Reports LLC (including members of their household) own securities of Barrick Gold Corp. and Agnico Eagle Mines Ltd.,
- Barry Dawes: I, or members of my immediate household or family, own securities of: North Star Resources Ltd. I determined which companies would be included in this article based on my research and understanding of the sector.
- Statements and opinions expressed are the opinions of the author and not of Streetwise Reports, Street Smart, or their officers. The author is wholly responsible for the accuracy of the statements. Streetwise Reports was not paid by the author to publish or syndicate this article. Streetwise Reports requires contributing authors to disclose any shareholdings in, or economic relationships with, companies that they write about. Any disclosures from the author can be found below. Streetwise Reports relies upon the authors to accurately provide this information and Streetwise Reports has no means of verifying its accuracy.
- This article does not constitute investment advice and is not a solicitation for any investment. Streetwise Reports does not render general or specific investment advice and the information on Streetwise Reports should not be considered a recommendation to buy or sell any security. Each reader is encouraged to consult with his or her personal financial adviser and perform their own comprehensive investment research. By opening this page, each reader accepts and agrees to Streetwise Reports' terms of use and full legal disclaimer. Streetwise Reports does not endorse or recommend the business, products, services or securities of any company.
For additional disclosures, please click here.


