Renegade Gold Inc. (RAGE:TSX; TGLDF:OTC; 070:FRA) has one of the largest land packages of highly prospective gold and critical mineral-bearing properties in the Red Lake district of Ontario, Canada.
The company's properties are in the exploration and development stages with substantial reserves already having been defined. Before we examine the charts for the company's stock to see why it is such a Strong Buy here with really big upside potential, we will first see why it is such an attractive investment from a fundamental standpoint, using illustrations from the company's latest investor deck.
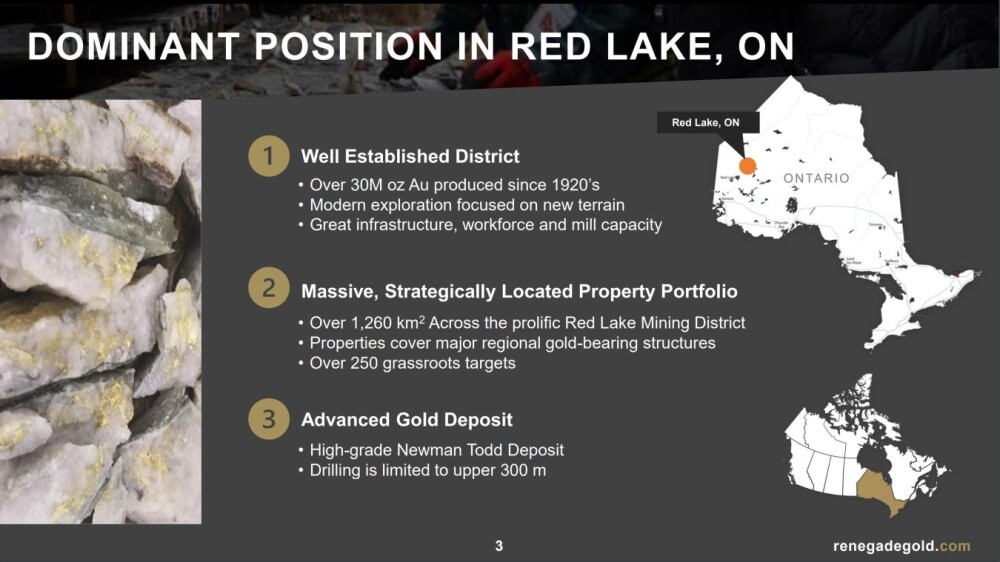
The first slide from the investor deck shows the location of the company's properties in NW Ontario and briefly overviews the principal attributes and advantages of the company.
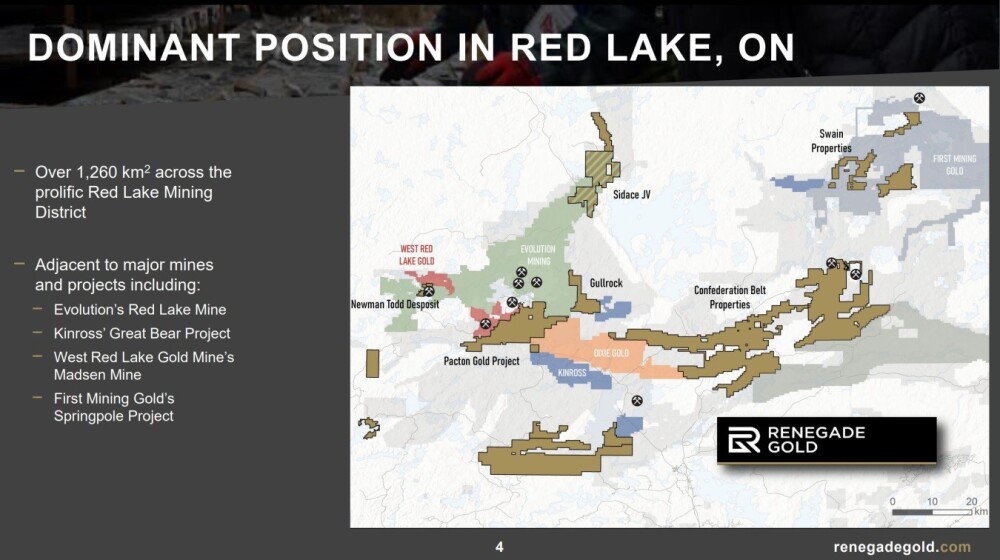
The next slide shows the company's impressive 1260 square km property portfolio in the Red Lake district, which exceeds that of all other companies in the area.
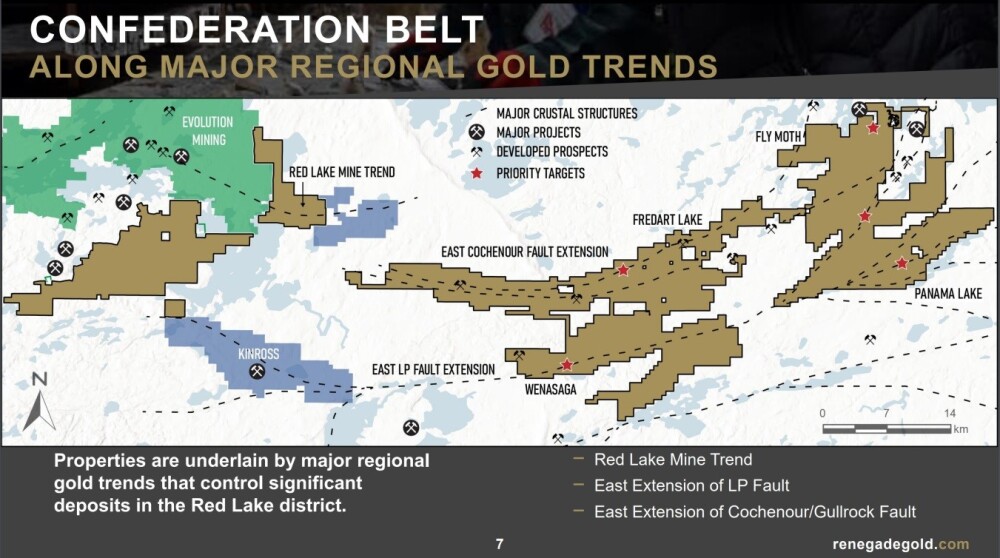
This slide shows Renegade's major projects and priority targets in the Confederation Belt.
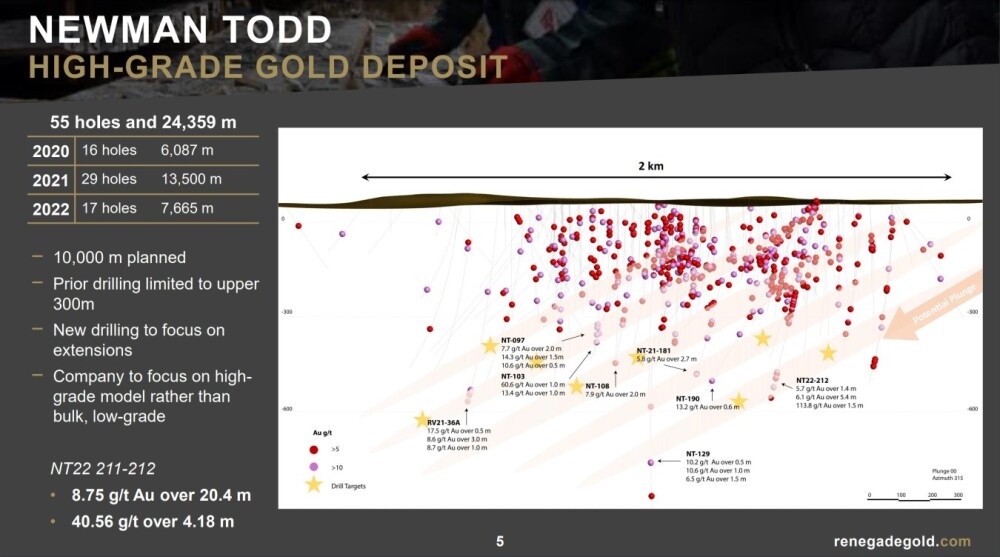
The company's Newman Todd gold project has already turned up impressive grades with more drilling in the pipeline.
This next slide shows the location and extent of the company's Pacton Project and the fact that adjacent Evolution Mining Ltd. (EVN:ASX) and West Red Lake Gold Mines Inc. (WRLG:TSXV; WRLGF:OTCQB) have major projects nearby, certainly augurs well for future discoveries at Pacton.
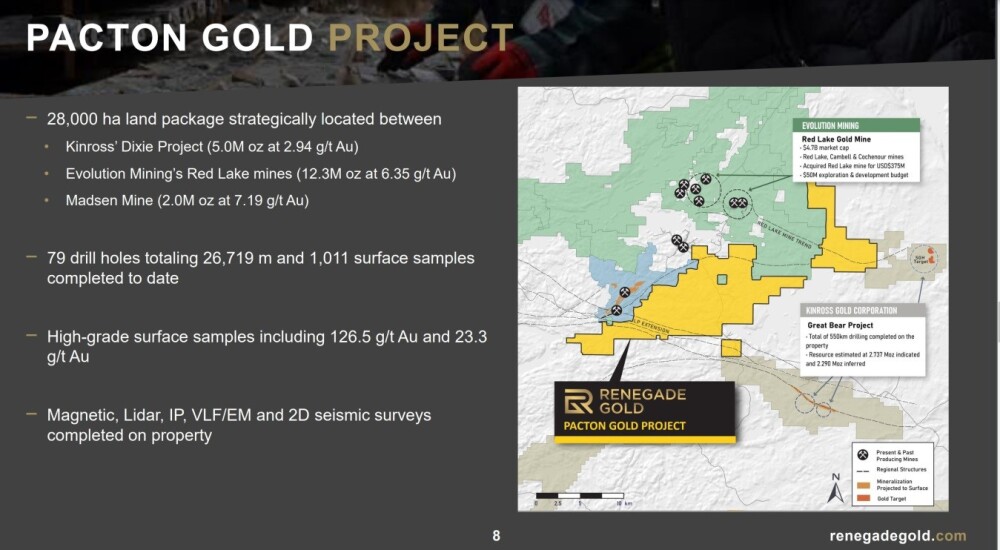
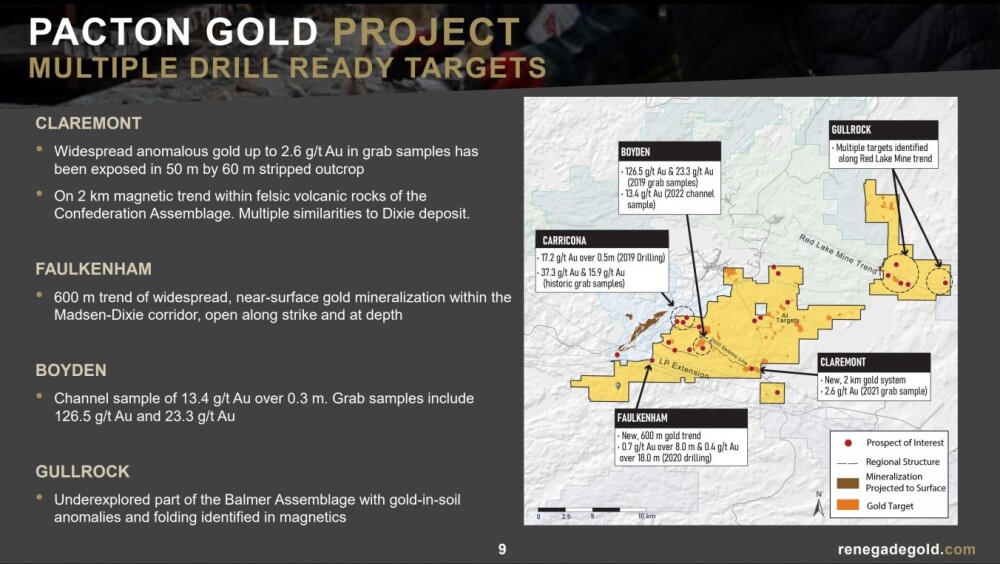
There are multiple drill ready targets at Pacton, details on this slide.
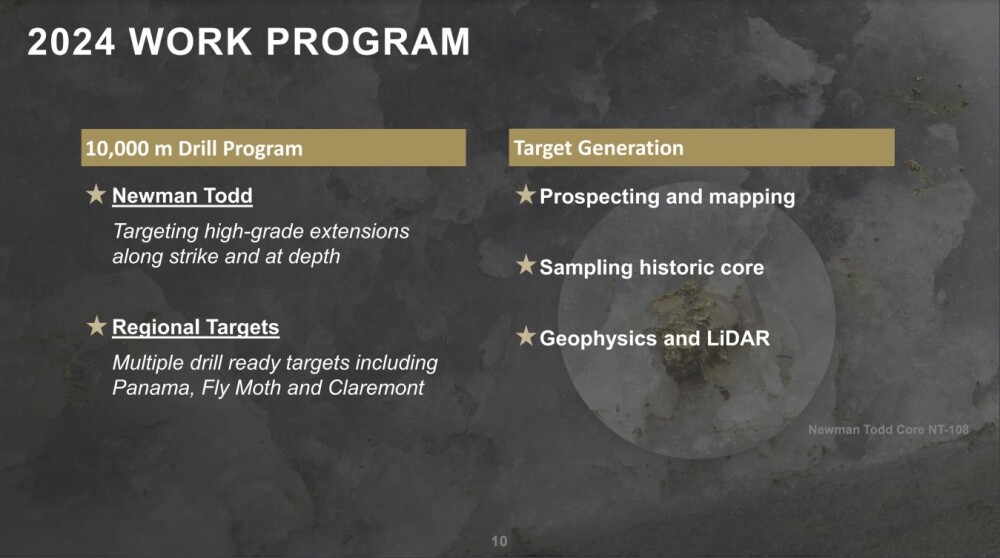
Lastly, this slide shows the work underway this year.
The stock charts for Renegade Gold present a most encouraging picture of a stock that is in the late stages of a basing process that will, before long, lead to a breakout into a major bull market.
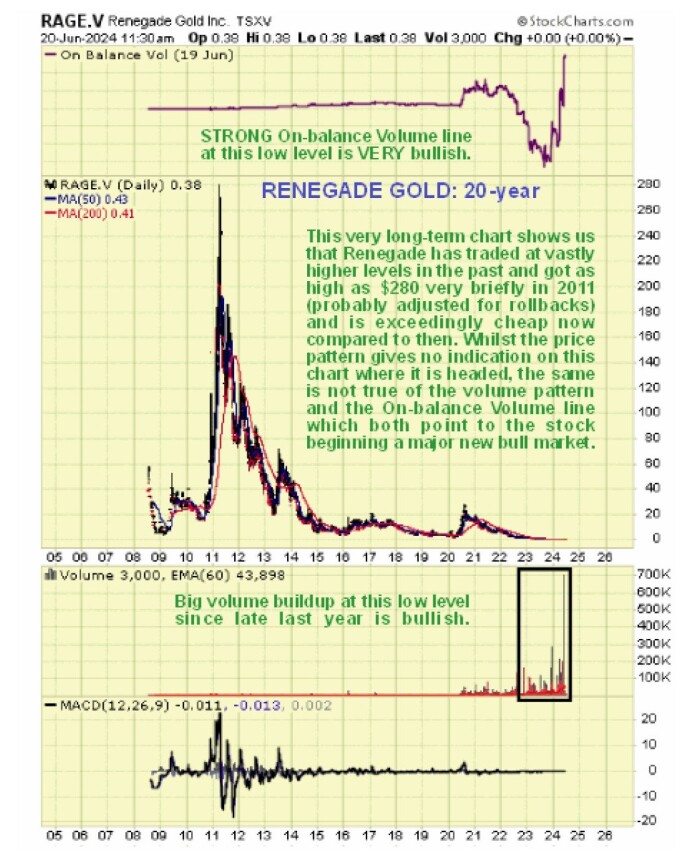
We will start by looking at a very long-term 20-year chart to gain an overview of where the stock is in relation to its past history. On this chart, we see that when it peaked way back in 2011, it was at a vastly higher level (adjusted for rollbacks) than where it is now, which makes clear that in comparative terms, the stock is currently exceedingly cheap — a situation that is not expected to persist, for reasons that we will come to.
While the current price pattern gives little indication of where it is headed because this is a long-term arithmetic chart and recent action is thus "squashed flat," the recent volume pattern and On-balance Volume indicator are strongly bullish, with a significant volume buildup in recent months and the OBV line trending steeply higher which taken together suggest that a bull market is at hand.
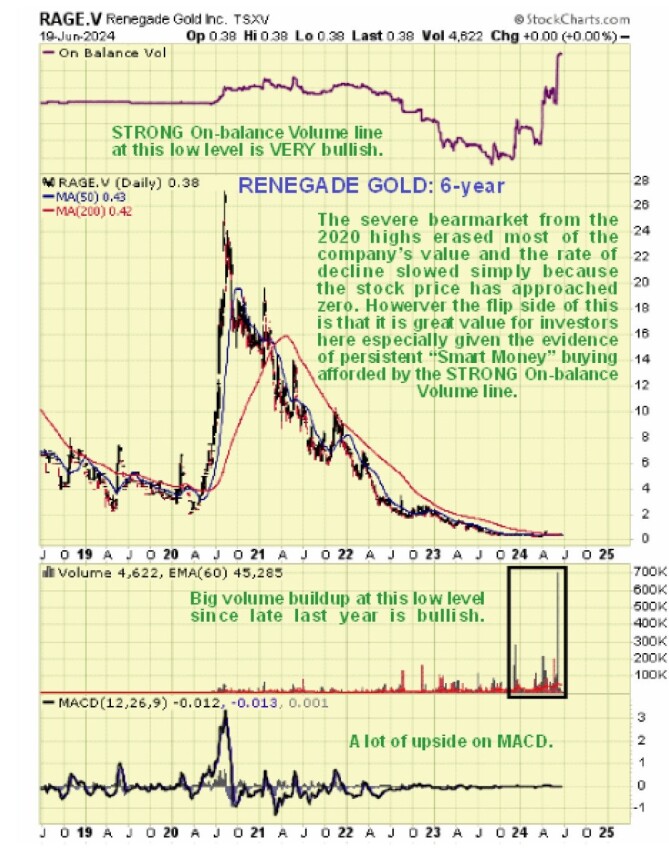
Zooming in now via the 6-year chart, we see that the decline from the 2020 peak, which doesn't look all that great on the 20-year chart, opens out into a severe bear market in its own right that resulted in the stock losing most of its value from this peak.
Here, we see that the On-balance Volume line has been rising steeply since late last year as volume has built up, a very positive sign. The Accumulation line (not shown) has been weak until recently but is now starting higher. Again, because this is an arithmetic chart that squashes recent action flat, it is hard to make sense of the price pattern, but we can address this problem by using a log chart.
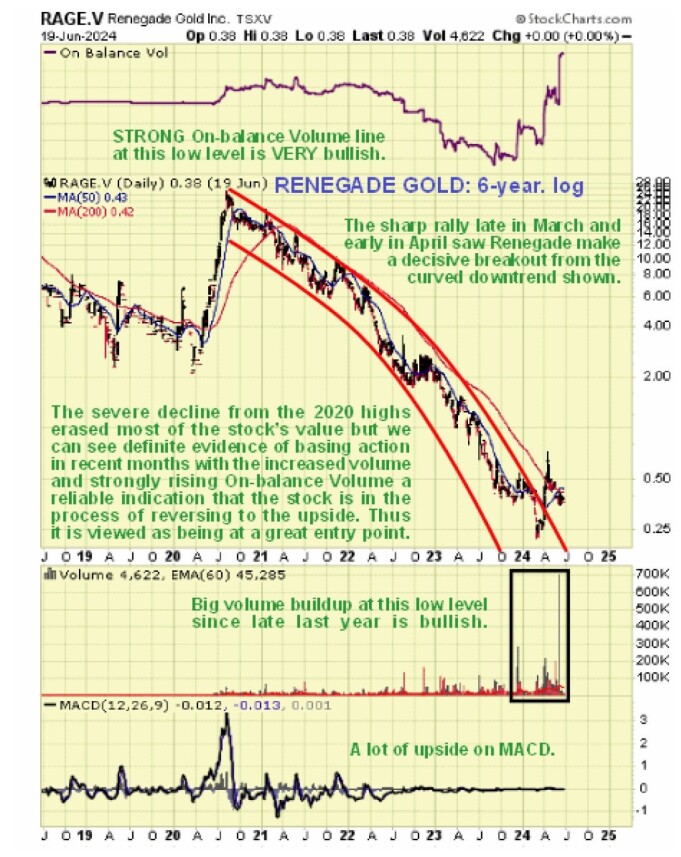
The log chart for the same time period, 6 years, opens out the recent low-level price action, and whereas the decline appears to have been decelerating on the arithmetic chart for the simple reason that the price was approaching zero, on the long-term chart, it appears to have been accelerating since it is a ratio chart.
Most importantly, it shows us that a base pattern has been building out since late last year that has already broken the price out of the accelerating or curved downtrend shown on this chart that we will now proceed to look at in much more detail on an 18-month chart.
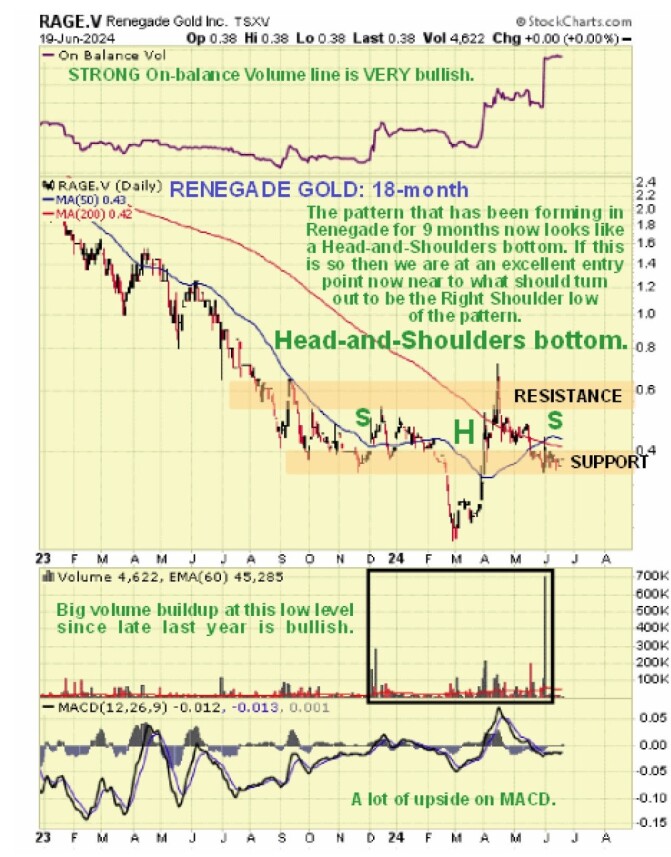
The 18-month chart really shows what has been going on in the recent past. On it, we see that a Head-and-Shoulders bottom has been forming since about last September, with the clear Head of the pattern building out late in February and early in March that has been followed by a bullish sharp rally on strong volume.
Right now the stock is at a favorable entry point because the price is at or very close to what should turn out to be the Right Shoulder low of the pattern at the support level shown. Here, we should note that if this base pattern turns out to be roughly symmetrical, then the Right Shoulder could continue building out for a while longer yet, but having said that, we are clearly at a good point to buy now.
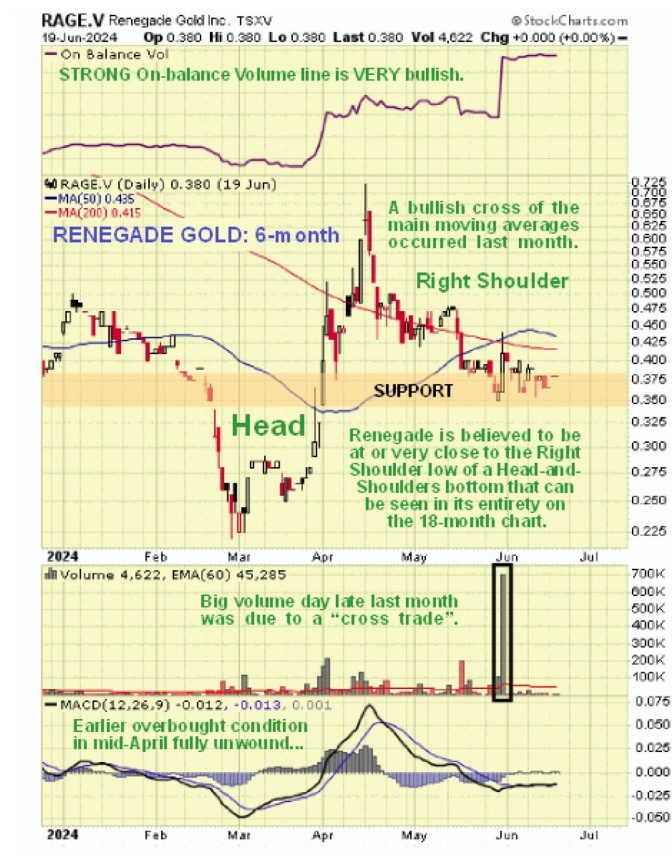
We can observe recent action in much more detail on the 6-month chart.
Here, we see that the vigorous rally to form the right side of the Head of the H&S bottom was on strong volume, but as it resulted in the stock becoming very overbought, it was followed by a normal reaction that has taken the form of a bullish Falling Wedge or Pennant which has brought the price back to form the Right Shoulder of the pattern with this pattern promising renewed advance — the boundaries of this Pennant or Wedge have not been drawn on the chart to avoid clutter.
All the above charts show that Renegade's stock has big upside from here and very little downside, especially given the strong evidence of accumulation of the stock in recent months, and we should keep in mind the now outstandingly positive outlook for the sector with a commodity price boom on the horizon as currencies collapse and inflation continues to ramp up.
Renegade Gold stock is therefore viewed as exceptionally attractive at this juncture, and it is rated a Strong Buy for all time horizons.
Renegade Gold's website.
Renegade Gold Inc. (RAGE:TSX; TGLDF:OTC; 070:FRA) closed for trading at CA$0.38, US$0.26726 on June 19, 2024
Want to be the first to know about interesting Gold investment ideas? Sign up to receive the FREE Streetwise Reports' newsletter.
Subscribe
Important Disclosures:
- For this article, the Company has paid Street Smart, an affiliate of Streetwise Reports, US$1,500 in addition to the monthly consulting fee.
- As of the date of this article, officers and/or employees of Streetwise Reports LLC (including members of their household) own securities of Renegade Gold Inc. and West Red Lake Gold Mines Inc.
- Author Certification and Compensation: [Clive Maund of clivemaund.com] was retained and compensated as an independent contractor by Street Smart to write this article. Mr. Maund is a technical analyst who analyzes historical trading data and he received his UK Technical Analysts’ Diploma in 1989. The recommendations and opinions expressed in this content reflect the personal, independent, and objective views of the author regarding any and all of the companies discussed. No part of the compensation received by the author was, is, or will be directly or indirectly tied to the specific recommendations or views expressed.
- Statements and opinions expressed are the opinions of the author and not of Streetwise Reports, Street Smart, or their officers. The author is wholly responsible for the accuracy of the statements. Streetwise Reports requires contributing authors to disclose any shareholdings in, or economic relationships with, companies that they write about. Any disclosures from the author can be found below. Streetwise Reports relies upon the authors to accurately provide this information and Streetwise Reports has no means of verifying its accuracy.
- This article does not constitute investment advice and is not a solicitation for any investment. Streetwise Reports does not render general or specific investment advice and the information on Streetwise Reports should not be considered a recommendation to buy or sell any security. Each reader is encouraged to consult with his or her personal financial adviser and perform their own comprehensive investment research. By opening this page, each reader accepts and agrees to Streetwise Reports' terms of use and full legal disclaimer. Streetwise Reports does not endorse or recommend the business, products, services, or securities of any company.
For additional disclosures, please click here.
Clivemaund.com Disclosures
The above represents the opinion and analysis of Mr. Maund, based on data available to him, at the time of writing. Mr. Maund's opinions are his own, and are not a recommendation or an offer to buy or sell securities. As trading and investing in any financial markets may involve serious risk of loss, Mr. Maund recommends that you consult with a qualified investment advisor, one licensed by appropriate regulatory agencies in your legal jurisdiction, and do your own due diligence and research when making any kind of a transaction with financial ramifications. Although a qualified and experienced stock market analyst, Clive Maund is not a Registered Securities Advisor. Therefore Mr. Maund's opinions on the market and stocks cannot be construed as a recommendation or solicitation to buy and sell securities.


