Rex Resources Corp. (OWN:TSX; 94G:FWB) is a copper, gold, and silver exploration company with properties on Vancouver Island, British Columbia, whose stock looks ready to break out into a major new bull market soon.
Before looking at the latest stock charts, we will gain a fundamental overview of the company using selected pages / slides from its investor deck.
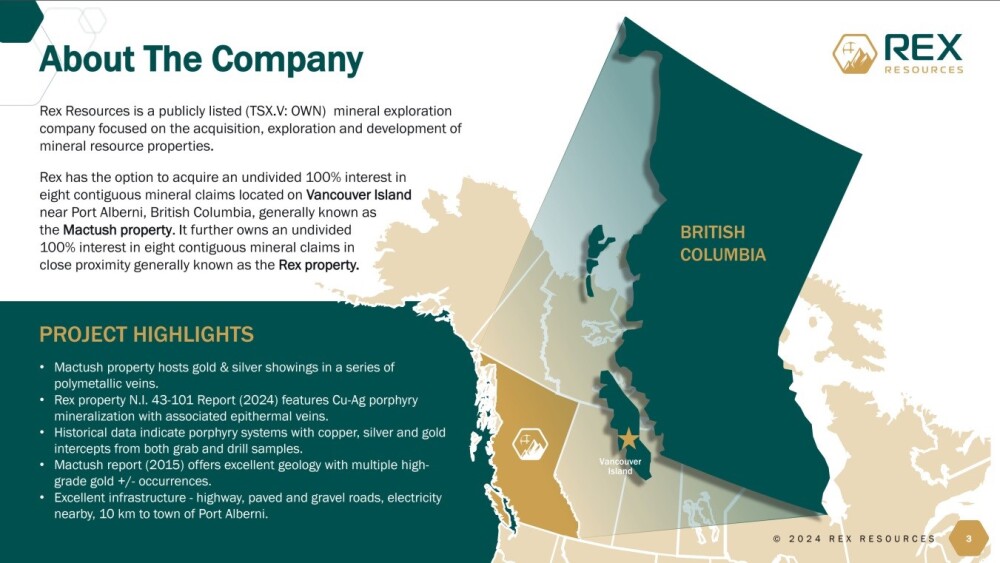
The first slide from the deck shows the location of the company's properties on Vancouver Island, BC. They consist of two claim groups that are not far from each other, with each of them being comprised of eight contiguous mineral claims. The company has the option to acquire a 100% undivided interest in one of them, the MacTush property, and already has an undivided 100% interest in the other, known as the Rex property.
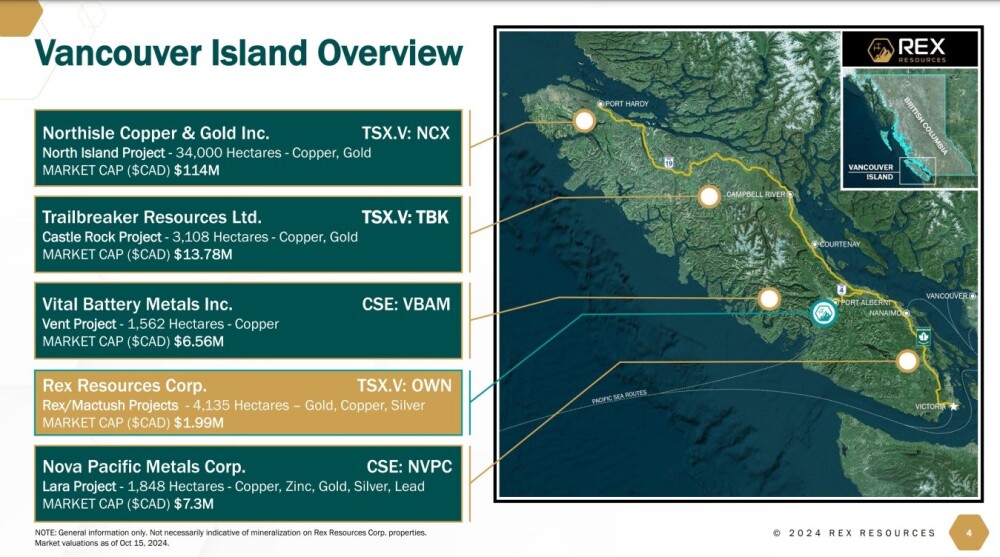
This slide shows the exact location of the company's properties on Vancouver Island and the location of the properties of other mining companies active on the island whose presence clearly improves the chances of Rex making significant discoveries.
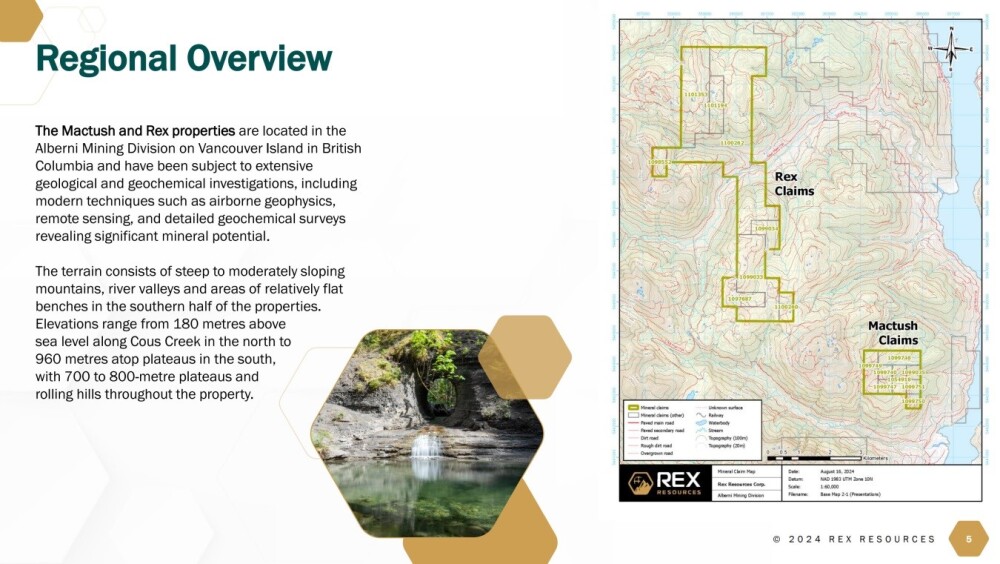
The next slide shows the geographical extent of each of the two claim groups and their proximity to each other.
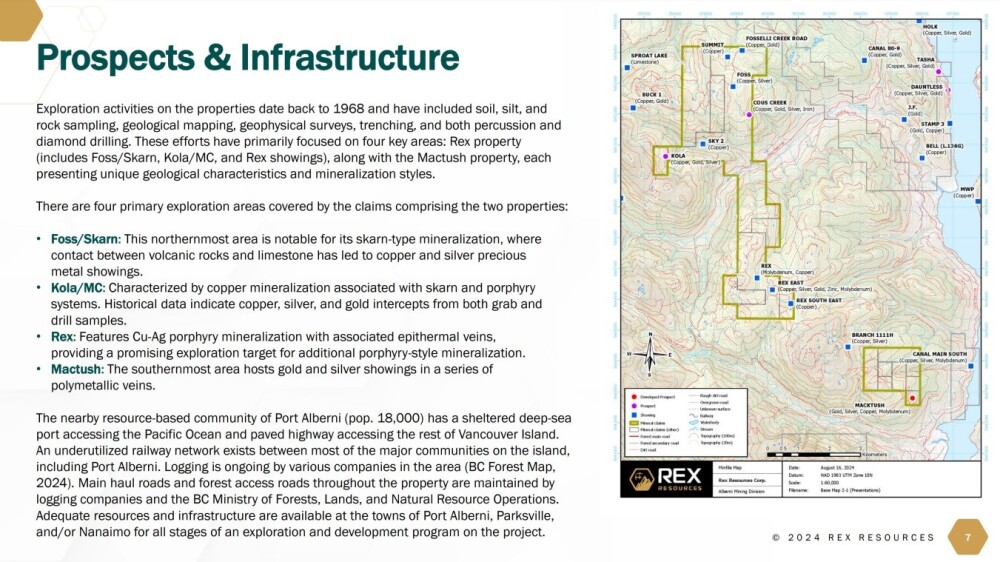
This slide provides a brief description of the four primary exploration areas lying within the claims and details the local infrastructure.
The slide below shares highlights of the Mactush Property.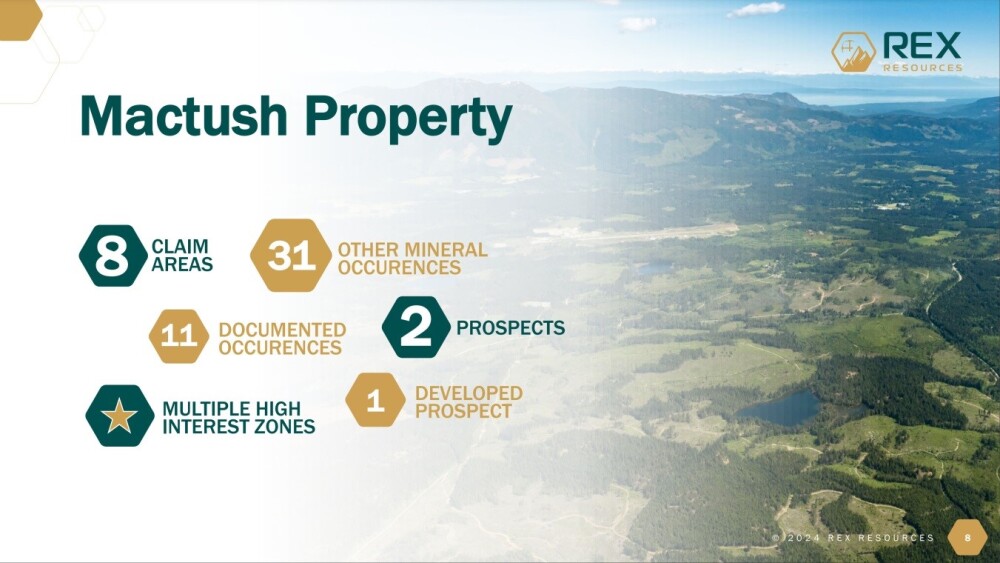
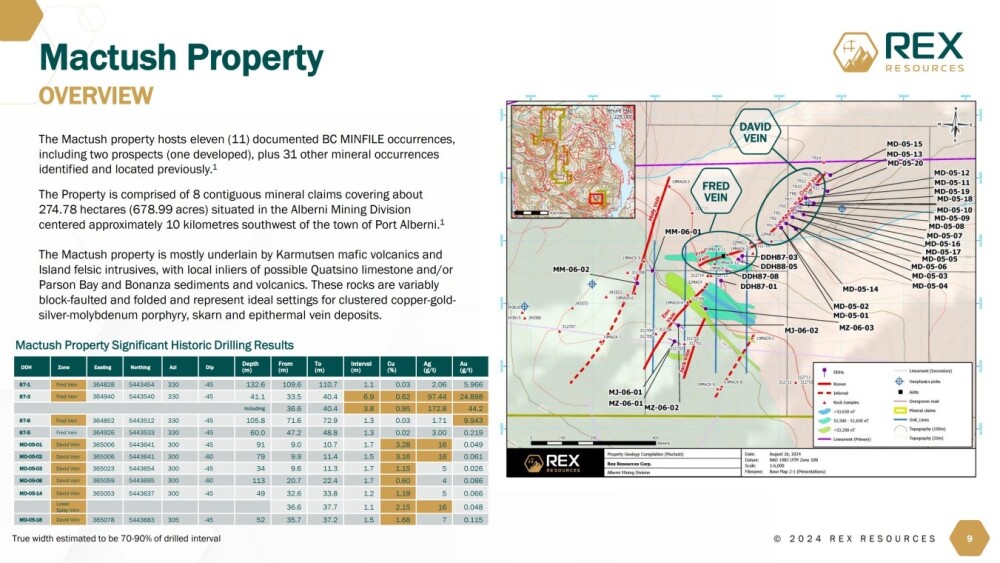
Below is an overview of the Mactush property, which includes a table showing significant historic drilling results.
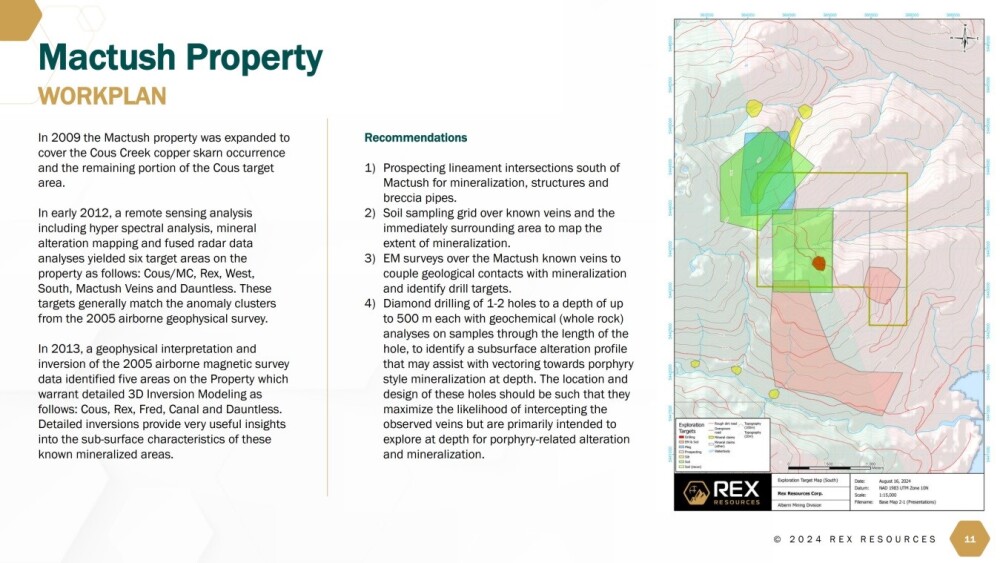
This slide provides a "work plan" or way forward for developing the Mactush property in the light of past exploration efforts and discoveries.
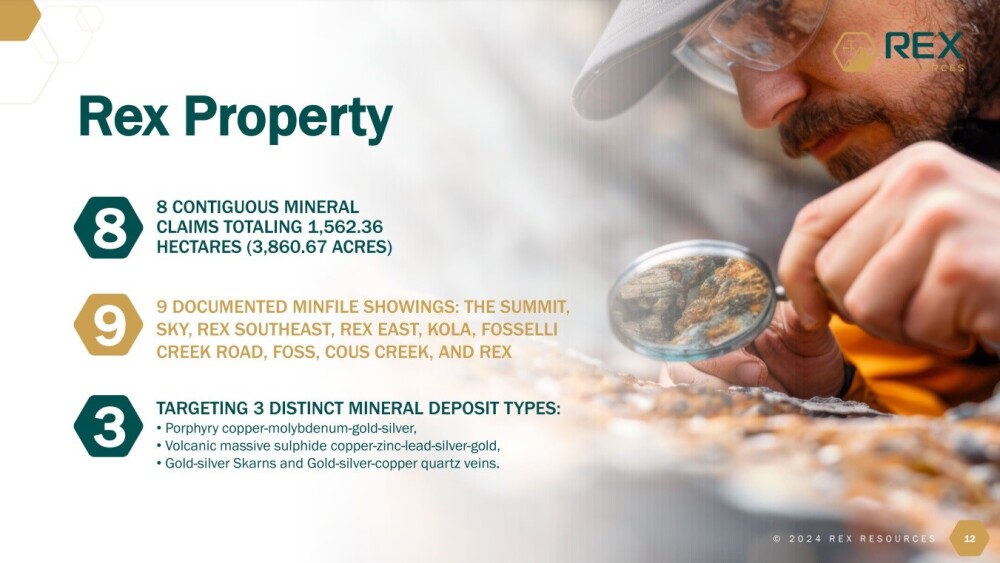
The slide below highlights the Rex Property.
The slide below overviews the northern section of the Rex Property.

This one overviews the southern section of the Rex Property.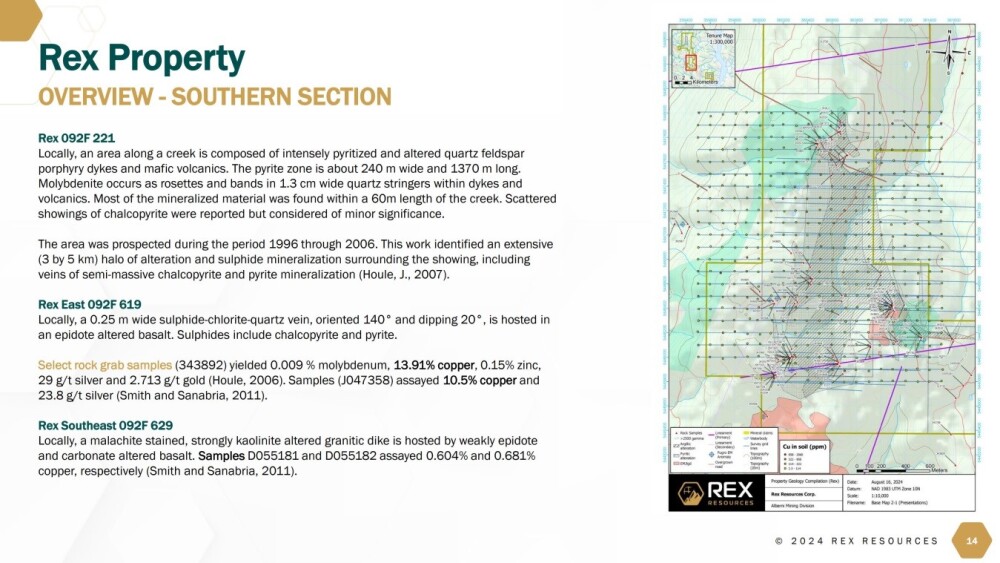
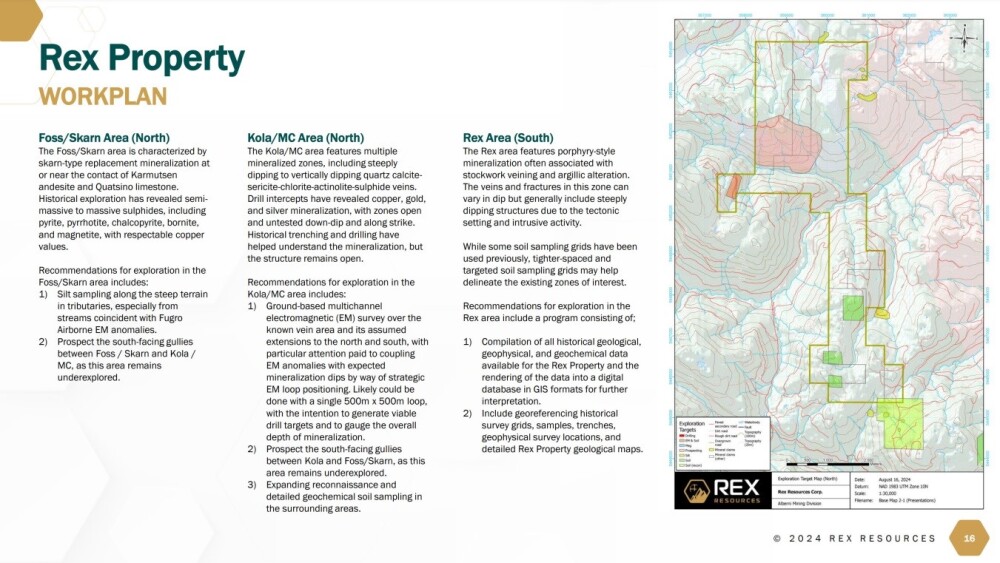
Below is the "work plan" for the Rex Property.
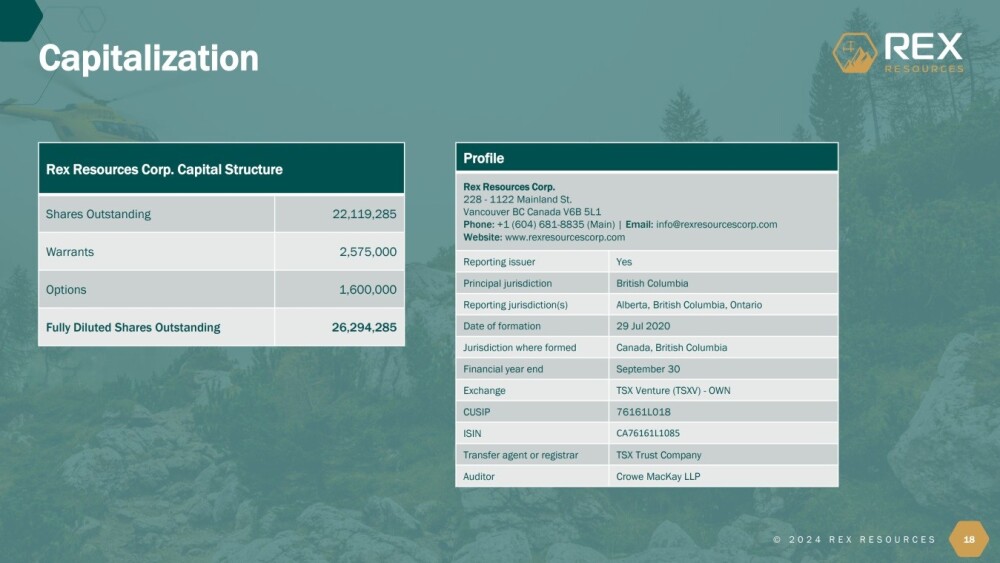
We end by looking at a slide showing the capitalization of the company, and we see that the company has a very reasonable 22.1 million shares in issue.
For details of the exploration history of the properties and management, which are not included for space reasons, please refer to the company investor deck.
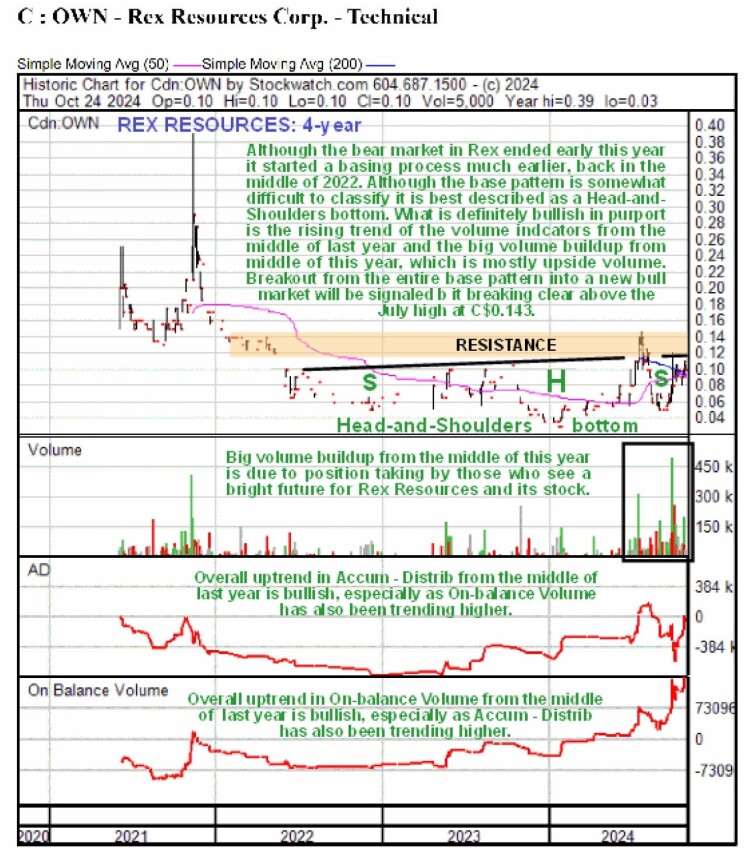
Turning now to the stock charts for Rex Resources and starting with the 4-year chart, we see that, following a severe bear market that saw it decline from a peak at CA$0.39 late in 2021 to bottom at 3 cents in January of this year for an over 90% drop from high to low, the price has stabilized and started to advance and we can also see that a basing process began as far back as the middle of 2022 and while it is somewhat hard to define, it is best described as a Head-and-Shoulders bottom.
The most important points to observe, however, relate to the volume pattern and volume indicators — both the Accumulation line and On-balance Volume lines have been trending quite strongly higher since the middle of last year, which gives added significance to the big volume buildup evident from the middle of this year, which is mostly upside volume.
This indicates persistent heavy buying by those who see a bright future for the company and its stock and since this buying has been met with selling which — so far — has stopped the price from advancing much, it is an indication of a high degree of rotation of stock from weaker to stronger hands, which is self-evident as most of the sellers in this area are selling for a loss.
What this means is that once selling in this price area has been fully absorbed — and the completion of the Head-and-Shoulders bottom is an indication that we are close to that point — then anyone wanting to buy the stock will have to bid up the stock.
This is why what we are seeing here with respect to the volume pattern and volume indicators is so bullish. A breakout above the July peak and the resistance marking the upper boundary of the pattern will mark the start of a major bull market and should trigger a period of accelerating advance; with the Right Shoulder of the H&S bottom looking about complete, we believe to be very close to such a breakout.
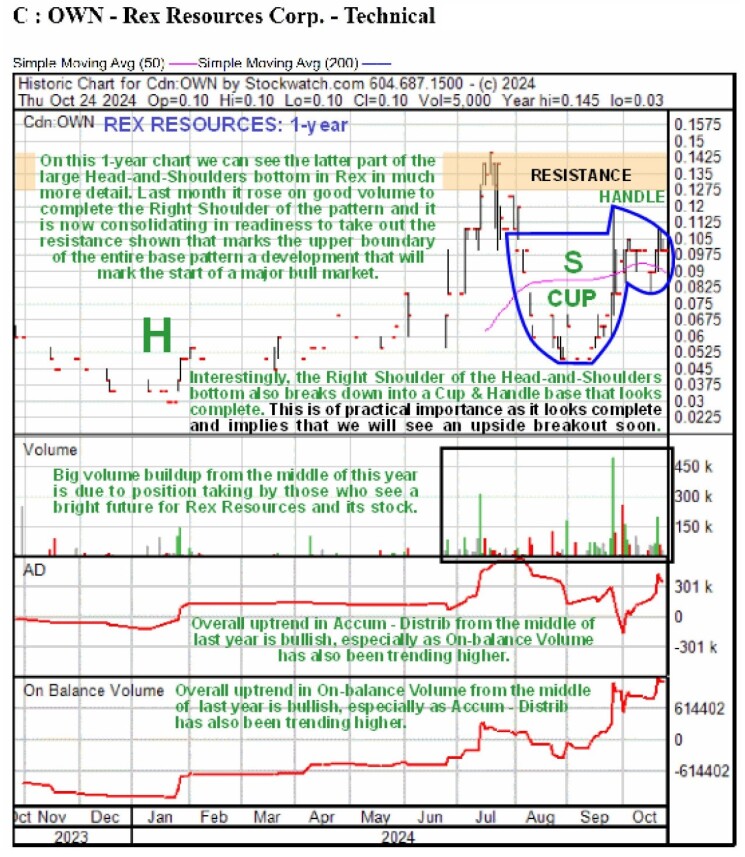
Moving on, the 1-year chart enables us to examine recent action in much more detail. This chart shows the latter part of the Head-and-Shoulders bottom, and on it, we can see that the price rose strongly last month on good volume to complete the Right Shoulder of the base pattern, putting it in position for a major breakout.
Interestingly, we can further see that the Right Shoulder is comprised of a small Cup and Handle base, and since this little pattern is also complete, it implies that the price will soon attack the resistance level shown at the top of the entire base pattern and take it out, thus ushering in the expected major bull market.
Rex Resources is, therefore, much liked here and is rated an Immediate Strong Buy for all time horizons.
Rex Resources' website.
Rex Resources Corp. (OWN:TSX; 94G:FWB) closed for trading at CA$0.10 on October 24, 2024.
| Want to be the first to know about interesting Gold, Critical Metals, Silver and Base Metals investment ideas? Sign up to receive the FREE Streetwise Reports' newsletter. | Subscribe |
Important Disclosures:
-
For this article, the Company has paid Street Smart, an affiliate of Streetwise Reports, US$2,500.
- Author Certification and Compensation: [Clive Maund of clivemaund.com] was retained and compensated as an independent contractor by Street Smart to write this article. Mr. Maund is a technical analyst who analyzes historical trading data and he received his UK Technical Analysts’ Diploma in 1989. The recommendations and opinions expressed in this content reflect the personal, independent, and objective views of the author regarding any and all of the companies discussed. No part of the compensation received by the author was, is, or will be directly or indirectly tied to the specific recommendations or views expressed.
- Statements and opinions expressed are the opinions of the author and not of Streetwise Reports, Street Smart, or their officers. The author is wholly responsible for the accuracy of the statements. Streetwise Reports requires contributing authors to disclose any shareholdings in, or economic relationships with, companies that they write about. Any disclosures from the author can be found below. Streetwise Reports relies upon the authors to accurately provide this information and Streetwise Reports has no means of verifying its accuracy.
- This article does not constitute investment advice and is not a solicitation for any investment. Streetwise Reports does not render general or specific investment advice and the information on Streetwise Reports should not be considered a recommendation to buy or sell any security. Each reader is encouraged to consult with his or her personal financial adviser and perform their own comprehensive investment research. By opening this page, each reader accepts and agrees to Streetwise Reports' terms of use and full legal disclaimer. Streetwise Reports does not endorse or recommend the business, products, services, or securities of any company.
For additional disclosures, please click here.
Clivemaund.com Disclosures
The above represents the opinion and analysis of Mr. Maund, based on data available to him, at the time of writing. Mr. Maund's opinions are his own, and are not a recommendation or an offer to buy or sell securities. As trading and investing in any financial markets may involve serious risk of loss, Mr. Maund recommends that you consult with a qualified investment advisor, one licensed by appropriate regulatory agencies in your legal jurisdiction, and do your own due diligence and research when making any kind of a transaction with financial ramifications. Although a qualified and experienced stock market analyst, Clive Maund is not a Registered Securities Advisor. Therefore Mr. Maund's opinions on the market and stocks cannot be construed as a recommendation or solicitation to buy and sell securities.


